
In 2020, Africa’s biggest trading partner was the European Union, which accounted for 33% of the continent’s exports to and 31% of its imports from non-African countries. China was the second-largest trading partner, with 17% of exports and 22% of imports. Trade within the African continent made up 18% of Africa’s total exports and 15% of its total imports.
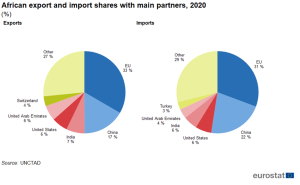
Figure 1: African export and import shares with main partners, 2020 (%)
In 2011, the European Union had a trade deficit of €9 billion with Africa, as imports from Africa were lower than exports to Africa (see Figure 2). This deficit expanded to €25 billion in 2012. However, from 2012 to 2016, imports from Africa declined significantly, transforming the trade deficit into a €33 billion trade surplus. This surplus then decreased to €8 billion in both 2018 and 2019. In 2020, the COVID-19 pandemic led to a drop in exports by €20 billion and imports by €36 billion, resulting in an increased trade surplus of €24 billion. By 2021, exports had risen by €21 billion and imports by €41 billion, which reduced the trade surplus to €4 billion.
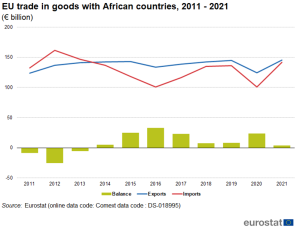
Figure 2: EU, trade in goods with African countries, 2011-2021 (€ billion)
Manufactured goods dominate exports to Africa
In 2011, manufactured goods constituted 72% of the EU’s exports to Africa (see Figure 3). By 2021, this percentage had decreased to 68%, while the proportion of primary goods increased from 27% to 31%. The reduction in the share of manufactured goods was primarily due to a decrease in the export of machinery and vehicles, which fell from 38% in 2011 to 32% in 2021. Meanwhile, the share of chemicals in the exports saw an increase during this period.
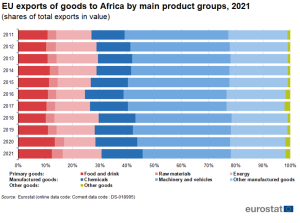
Figure 3: EU exports of goods to Africa by main product groups, 2021 (shares of total exports in value)
Primary goods dominate imports from Africa
Primary goods have been the dominant category for imports from Africa (see Figure 4). Nonetheless, their share declined from 76% in 2011 to 65% in 2021, largely because of the reduced proportion of energy imports, a change partially attributed to decreasing oil and gas prices. Over the same timeframe, the proportion of manufactured goods imported rose from 23% to 34%. This growth was mainly driven by an increase in the import of machinery and vehicles, which rose from 7% to 13%, and other manufactured goods, which increased from 13% to 16%.
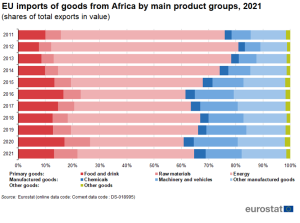
Figure 4: EU imports of goods from Africa by main product groups, 2021 (shares of total imports in value)
Northern Africa’s largest trade in goods partner
The value of goods the EU exported to Northern Africa increased from €59 billion in 2011 to €76 billion in 2021, reflecting an average annual growth rate of 2.6% (see Figure 5). The highest growth rate was observed in Eastern Africa at 2.7%, followed by Western Africa at 1.9% and Southern Africa at 0.2%. Conversely, exports to Middle Africa experienced a decline, with a growth rate of -3.3% during this period. Notably, exports to all African regions saw an uptick from 2020 to 2021.
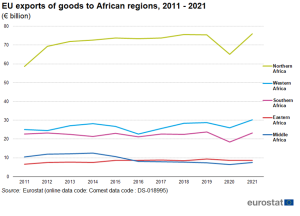
Figure 5: EU exports of goods to African regions, 2011-2021 (€ billion)
Figure 6 illustrates the trends in imports from the five African regions, revealing a decrease in average annual imports from Middle Africa (-5.1%) and Western Africa (-1.4%) between 2011 and 2021. Both Eastern Africa and Northern Africa experienced identical growth rates of 1.5%, while imports from Southern Africa saw a more substantial increase at 4.3%. Mirroring the trend in exports, EU imports from all five African regions rose from 2020 to 2021.
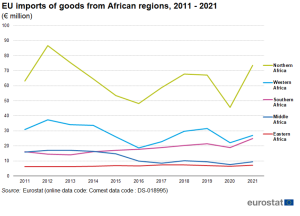
Figure 6: EU imports of goods from African regions, 2011-2021 (€ billion)
AZA Finance makes it easier for businesses to accelerate their operations, in, out, and within Africa, through better foreign exchange, treasury services, payments, and last-mile settlement.
Click here to find out more.
Sources:
Eurostat – Comext DS-018995